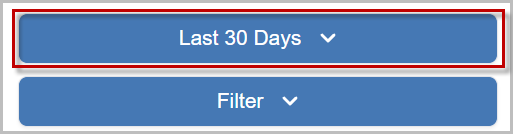
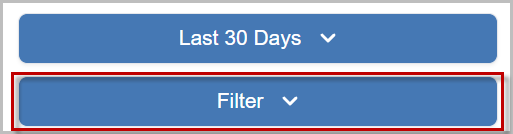
Filters
Some reports have a Date Filter, while all reports have a Filter button. Learn more about how to use them below.
- Use the Date Filter to modify the date range for the data in the visualization. Refer to the instructions for each report for more information about what data is modified by the Date Filter
- Use the Filter button to modify specific data sets, including Brand/Company and Users
Timeline
Some reports have a timeline visualization, located under the graph. Use this to drill down specific date ranges of the data.
- Click and drag the Scroll Bar to the left or right of the timeline to zoom in and out of the data
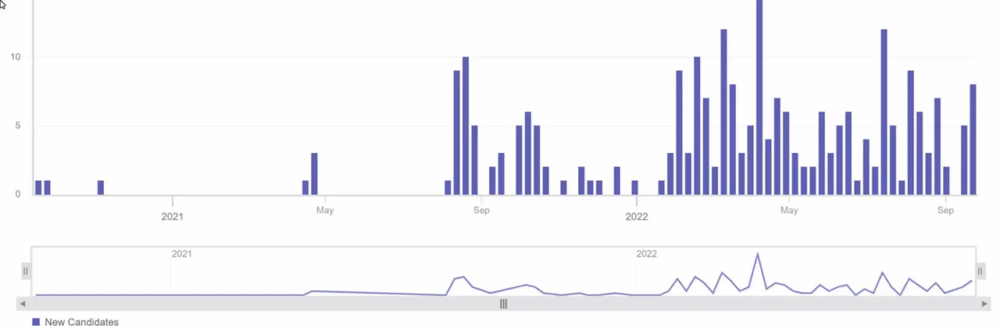
- Alternatively, you can use your mouse scroll to zoom in and out of the graph
For questions, comments, or issues, please contact us!